Fairness for Haida Gwaii's Internet Access
I have provided some open critiques of GwaiiTel’s plans to build fibre up and down the island, claiming that “the benefits will be realized only by communities south of Masset”. On a run the other day, I started running the numbers through my head and got a little uncomfortable with that assessment. So I wanted to write up a more detailed analysis with a few plots that help quantify where I believe the benefits will be distributed.
How do we measure “Fairness” for Internet connections?
I’ve said that this network setup will be “more fair to all of the communities”. The best measure of “fairness” for people’s Internet connections is probably per-capita bandwidth, i.e. each person’s share of the bandwidth when everyone on the island is using the Internet.
Population varies by community, as does the network infrastructure, so to calculate these, we need to get a few statistics on the communities. Let’s start by getting the populations of each of the communities on Haida Gwaii. 2014 statistics for incorporated municipalities (Masset, Port and Charlotte) are available here and we’ll take the remaining communities (Tow Hill, Old Masset, Tlell, Skidegate and Sandspit) from GoHaidaGwaii. The population of Tow Hill is “not available”, but I’ll be generous and call it 200 (corrections welcome).
I’m going to split the populations into two groups: “northern” and “southern” since my hypothesis is that GwaiiTel’s plan to build fibre the length of the island only helps communities south of Masset with their Internet bandwidth constraints.
northern = {'old_masset': 614, 'masset': 890, 'tow_hill': 200}
southern = {'skidegate': 709, 'sandspit': 297, 'charlotte': 941, 'tlell': 179, 'port': 371}
populations = southern.copy()
populations.update(northern)
populations
{'charlotte': 941,
 'masset': 890,
 'old_masset': 614,
 'port': 371,
 'sandspit': 297,
 'skidegate': 709,
 'tlell': 179,
 'tow_hill': 200}
Referring back to GwaiiTel’s network architecture diagram, we’ll assume that each community’s connection to its Point-of-Presence (POP) is it’s bottleneck. We’ll call this the community link speed in megabits per second (Mbps).
And just so everyone is clear, 1 gigabit per second (Gbps) is 1024 times larger than 1 megabit per second (Mbps) which is 1024 times larger than 1 kilobit per second (1 kbps) which is 1024 bits per second.
link_speeds = {
    'skidegate': 10,
    'sandspit': 10,
    'charlotte': 100,
    'tlell': 10,
    'port': 10,
    'old_masset': 100,
    'masset': 1024,
    'tow_hill': 0
}
Thus, the per-capita bandwidth (in kbps) for each community is the link speed divided by the population times “one thousand”.
per_capita_bw = { community: link_speeds[community] / populations[community] * 1024 for community in populations.keys() }
per_capita_bw
{'charlotte': 108.82040382571732,
 'masset': 1178.1752808988765,
 'old_masset': 166.77524429967426,
 'port': 27.601078167115904,
 'sandspit': 34.47811447811448,
 'skidegate': 14.442877291960508,
 'tlell': 57.20670391061452,
 'tow_hill': 0.0}
Let’s plot this with a bar plot such that the width of the bar is the population and the height of the bar is the per capita bandwidth.
%matplotlib inline
import pylab as pl
import numpy as np
x = np.cumsum([0] + list(populations.values())[:-1])
x
array([ 0, 297, 911, 1852, 2031, 2402, 3111, 3311])
y = np.array(list([per_capita_bw[community] for community in populations.keys()]))
y
array([   34.47811448,   166.7752443 ,   108.82040383,    57.20670391,
          27.60107817,    14.44287729,     0.        ,  1178.1752809 ])
w = np.array(list(populations.values()))
w
array([297, 614, 941, 179, 371, 709, 200, 890])
def plot_percap_bandwidth(*bw):
    colors = ('b', 'g', 'r', 'y')
    ax = pl.axes()
    for y, color in zip(bw, colors):
        ax.bar(x, y, width=w, tick_label=populations.keys(), color=color)

    ax.set_ylabel("Per capita bandwidth (kbps)")
    ax.set_xticks(x + w / 2)
    ax.set_xticklabels(populations.keys(), rotation=45)
    return ax
plot_percap_bandwidth(y)
<matplotlib.axes._subplots.AxesSubplot at 0x7f411ca8ba20>
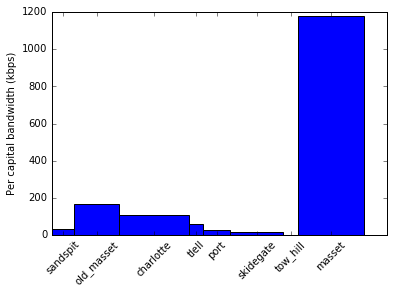
Masset ends up looking pretty good by this metric, but in reality, there are two other bottlenecks in the system. The fibre carrying the southern community’s traffic is limited to 200 Mbps, and all of the island’s traffic is limited to about 350 Mbps.
If we add up each of the link speeds for the southern communities, we see that they don’t actually max out the 200 Mpbs on Telus’s fibre link:
sum([link_speeds[community] for community in southern.keys()])
140
So let’s assume that the southern communities get all of the 140 Mpbs that they can use on the off-island link, and Masset, Old Masset and Tow Hill get the rest.
remaining = 350 - 140
remaining
210
northern_bw = remaining / (populations['masset'] + populations['old_masset']) * 1024
northern_bw
142.9787234042553
That looks pretty accurate to me as that’s about the minimum bandwidth that I see at our home during periods of heavy usage (e.g. evenings when more people are using the Internet).
Let’s update our map of community bandwidth and update the plot.
per_capita_bw.update({'old_masset': northern_bw, 'masset': northern_bw})
original_per_capita_bw = per_capita_bw.copy()
y = list(per_capita_bw[community] for community in populations.keys())
plot_percap_bandwidth(y)
<matplotlib.axes._subplots.AxesSubplot at 0x7f411ca44160>
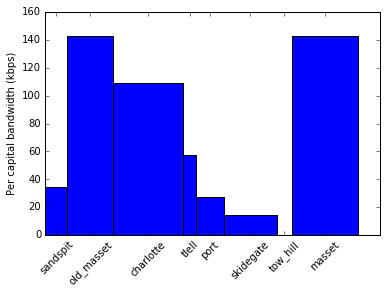
From this perspective, Masset, Old Masset and Charlotte all have much greater per capita bandwidth, than Port, Sandspit, Tlell and Skidegate who have half of that or less. So contrary to my initial assertion that the northern communities presently have it better than those south of Masset, this plot shows a slightly different story. Charlotte may be grouped in with the communities enjoying an advantage.
Fibre up the Island
The cornerstone of GwaiiTel’s plan is to build fibre from Charlotte to Masset (potentially with a line out to Tow Hill). I don’t think that it’s been reported what the bandwidth of that will be, but let’s assume that it’s 10 Gbps. Much, much more than our off island bandwidth, in any case. So to calculate the per-capita bandwidth, we can pretty much treat all of the communities the same, lump the population together and divide by the off-island bottleneck
island_wide_per_capita_bw = 350 / sum(list(populations.values())) * 1024
island_wide_per_capita_bw
85.31302070935492
y = [island_wide_per_capita_bw] * len(populations)
plot_percap_bandwidth(y)
<matplotlib.axes._subplots.AxesSubplot at 0x7f411c991b00>
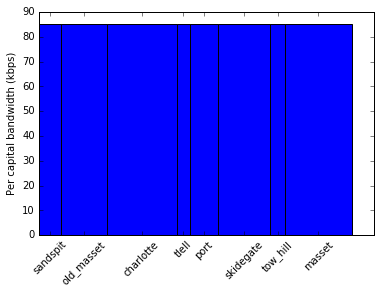
This, in and of itself, would simply be a redistribution of bandwidth. Masset, Old Masset and Charlotte would be giving up around 50% of their current bandwidth to bring the other communities up to par.
That however, is not the only part of the project. GwaiiTel is also planning on adding a second set of radios to our MDR tower to double the island’s Internet bandwidth.
Wait… do we need the fibre?
First, let’s take a look at what would happen if GwaiiTel didn’t build the fibre, but instead addressed each of the communities’ point-of-presence bottlenecks. Just upgrade four communities to 100 Mbps connections to the POP with Telus’s fibre. I have argued that this would be a lot cheaper than building fibre, and would help solve bottlenecks for the southern communities (though of course, it’s not as “future proof”). Am I right about this?
link_speeds.update({
    'skidegate': 100,
    'sandspit': 100,
    'tlell': 100,
    'port': 100,
    })
Now all of the southern communities split the 200 Mbps Telus fibre equally.
southern_bw = 200 / sum(list(southern.values())) * 1024
southern_bw
82.01842210652784
per_capita_bw.update({community: southern_bw for community in southern.keys()})
per_capita_bw
{'charlotte': 82.01842210652784,
 'masset': 142.9787234042553,
 'old_masset': 142.9787234042553,
 'port': 82.01842210652784,
 'sandspit': 82.01842210652784,
 'skidegate': 82.01842210652784,
 'tlell': 82.01842210652784,
 'tow_hill': 0.0}
y = list(per_capita_bw[community] for community in populations.keys())
plot_percap_bandwidth(y)
<matplotlib.axes._subplots.AxesSubplot at 0x7f411ca9d390>
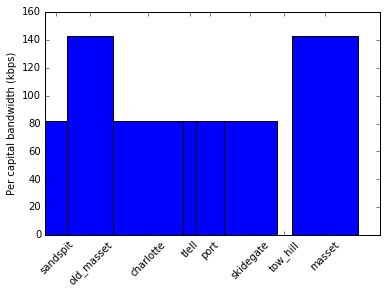
Under this scenario, Charlotte takes a bit of a hit on bandwidth to shore up the bandwidth of the other southern communities. But as GwaiiTel has said, the 200 Mbps Telus link would be a bottleneck if one were to go with this plan. To be clear, as far as I can tell, it’s not presently a bottleneck. However, it would become one if we went to upgrade anything else in the system. I stand partially corrected.
Doubling the bandwidth
If GwaiiTel doubles the off-island bandwidth to 700 Mbps and builds out fibre from Tow Hill to Charlotte, the per capita bandwidth calculation is super simple.
all_island_bw = 700 / sum(list(populations.values())) * 1024
all_island_bw
170.62604141870983
I have asserted that this plan will not really help the northern communities, and will simply bring the southern communities up to the standards that Masset has enjoyed to date. Am I right about that? Let’s plot the present (in green) vs. future (in blue).
future = [all_island_bw] * len(populations)
present = list(original_per_capita_bw[community] for community in populations.keys())
plot_percap_bandwidth(future, present)
<matplotlib.axes._subplots.AxesSubplot at 0x7f411c8d9fd0>
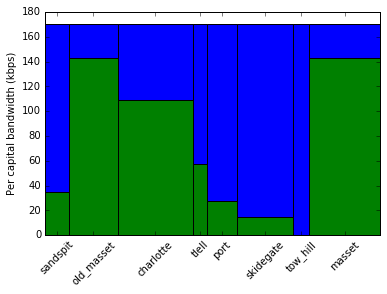
The plot shows that Port, Tlell, Skidegate and Sandpit, will indeed see “massive” improvements under this plan… somewhere around 3-5 times as much per capita bandwidth as they see at present. If GwaiiTel follows through on bringing fibre to Tow Hill, then their service will actually exist, which qualifies as “massive” gains as well. Kudos for GwaiiTel to making a plan that improves the service to these communities by so much!
The improvements that will be realized by Masset, Old Masset and Charlotte, however, are much more modest. Masset and Old Masset will see around a 20% increase in available per-capita bandwidth, while Charlotte will see around a 55% increase. This definitely isn’t nothing, so I stand corrected in asserting that Masset and Old Masset will see no benefit at all. According to this, however, I still feel good about my statements that the benefits are more incremental, at least for some islanders. The benefits are unevenly distributed between the communities, which is probably fair, since the communities seeing the benefits are those which have suffered poorer service to date.
Conclusions
Overall, I feel bad for being overly critical regarding GwaiiTel’s plan. But it seemed like there needed to be some balance and realism in a discussion that had been dominated by overwhelming boosterism. This plan will improve Internet service on Haida Gwaii, to varying degrees, depending on the community. And for that, GwaiiTel (and funding partners) should be commended for their diligence and hard work.
I look forward to seeing how this plays out. I think that the hope is that once the island is wired up, we can start discussing plans for an off-island fibre link that will really address our Internet bottleneck in a meaningful way. Indeed, GwaiiTel already has a commissioned report in hand that estimates the costs for such a plan (though I haven’t yet see it). I hope that that materializes and wish GwaiiTel all the best in these endeavors. Thanks for all your work so far! :)
PS: Corrections welcome
The numbers that I’ve used in this analysis and the assumptions that I have made are all based on press coverage, GwaiiTel’s website and whatever public data I could find. It represents my best understanding of the situation, but I acknowledge that I’m not infallible :) This page is executable, so the numbers are easily updatable. If you have more accurate numbers, or I’ve made a wrong assumption, please leave a comment and I’ll try to update the post.
blog comments powered by Disqus